Quantcast
Channel: Simulation Explained – SIMUL8 Blog
Viewing all 24 articles
Browse latest View live

Latest Academic Whitepapers on SIMUL8

$
0
0

Another great batch of papers have been published in the last month so we thought it was about time to share them with you!  As always, if yours is not included here (or in our full 2013 list here) just comment below and let us know!


Simulation for Design: New whitepaper

$
0
0

Simulation is integrated into the design process in many ways, but there are three typical scenarios.  You apply simulation when you want to:

  1. Model a future space that does not yet exist.
  2. Select the best of several alternative designs/layouts.
  3. Modify the current state of your process or space.

Spatial design cannot take place without knowing how the space will be used. By using simulation to think about how people move through the space, and how equipment is used in the area, you can test alternatives and find the best possible layout for your situation.

Read the rest of SIMUL8’s new whitepaper on ‘Simulation for Design’ by signing up below!


Name
Email
Company

How simulation & Lean improved passenger experience at London’s Gatwick Airport

$
0
0

Read our case study to learn how London’s Gatwick Airport used simulation and Lean techniques to improve the check-in process at its busy South Terminal. Developed using SIMUL8 software, the project was so successful that Gatwick Airport is now using the simulation to maintain overall passenger service from the point passengers enter the airport to the time they board the plane.

Gatwick Airport is one of the largest single runway airports in the world, with around 34.2 million passengers passing through the airport each year. The Six Sigma team at Gatwick Airport approached SIMUL8 to investigate ways to improve the check-in process, allowing them to test scenarios in a risk-free environment, thus minimizing any disruption caused to passengers. Working with SIMUL8’s consultants, the team were able to produce simulations of their check-in process and lounge areas that included real flight schedules and airline information. Check out the full case study on the SIMUL8 website.

If you’re interested in finding out more about Lean and simulation, visit the resource section of our website where you’ll find case studies, live demos and working examples.

Why Cloud is good for Simulation, and microbreweries!

$
0
0

We are doing loads of exciting “cloud” related things at SIMUL8 right now.

What does Cloud mean? Well, when you look what’s behind the buzzword you realize we have been doing some of it for many years – it just means making use of computing power that is somewhere out on the internet and you neither care where it is or who uses the power at times when you don’t need it.

Put simply it’s a shared resource that’s available when you need it from wherever you happen to be.

It’s great for simulation for several reasons:

1. Results: Many of us use a few idle machines around the office when we want to do many simulation runs, but now with the cloud “a few idle machines” means “an unlimited number of machines” so, for a few cents, we can temporarily use in parallel as many machines as we need to do all our runs at the same time.

This does not just mean rapid results, and potentially more accurate results, it also means we can try many more ideas.

Academic studies have shown that users who more rapidly see the impact of their idea will be more inspired to generate ideas and the ideas generated will be better. So with cloud you not only get faster results, but better results too.

2. It’s easy to distribute simulations: Our free “Viewer” has been around for over a decade but it still means installing something on the end user’s computer and that’s becoming more and more restricted by IT departments.

The cloud gets around this. YouSIMUL8.com is a simulation viewer in the cloud – nothing to install on the end user’s computer – just point them to your uploaded simulation like you might point them to a YouTube video. They can run the simulation, change parameters that you have made available, re-run the simulation etc.

3. Automated experimentation: Your simulation is built and you start using it for experimentation, you have been working on this all afternoon and you have tomorrow to do some more runs and write a report before a presentation on Friday. You arrive back in office Thursday morning and there are some new charts on your screen when you login. Wow – you can see the optimal number of each resource to hit the SLA!

What has happened is the initial experiments have sensed the variables you have been changing and SIMUL8 has seen there are spare (and so very low cost) CPUs available during the night out on the cloud (machines a bank uses during the day) so your simulation has been run thousands of times to find the relationship between the things you can change and the objective you want to achieve. All automatically (you had switched on permission for this).

Some very low cost capacity is available out on the cloud which can be used for intensive processing at very low marginal cost, suddenly making it possible to perform many more simulation experiments than was ever feasible in the past and so automatically drilling deeply into the multivariate relationships between inputs and outputs in your model.

Even when automated relationship searches are not useful a similar cloud based process can be used for sensitivity analysis on the assumptions in your simulation – those distributions you used for journey times, where you assumed the new freeway was going to reduce times by 15% – how much impact on your results do those distributions have?

Connected to the cloud, and with your permission, SIMUL8 can use low cost cloud resources (when available) to find out while you are getting on with something more important.

4. Making simulation more accessible to everyone: Every classic case of simulation success is in large organizations – sometimes small parts of large organizations, but nevertheless large organizations. Almost no one in small or medium enterprises (or non-profits) makes use of simulation because of perceived license cost and because of perceived time to create the simulation model.

We are currently part of a huge collaborative project to get simulation better used in smaller organizations. This project is using the cloud to create innovative licensing methods (free right now!) and web based templates for key common problems in certain small enterprises – so far we have ones in prototype for micro-breweries and cutting-tool manufacturers (the people who make the tools that cut everything from leather for handbags to fine card for pop-up greetings cards.) But there will be many more.

If you want to suggest a template you need, or get involved as a Small or Medium Enterprise get in touch.

Some reflections

Of course there is nothing much new in any of this, it has all been possible for years, it just didn’t use the Cloud buzzword. How was I running simulations 35 years ago? On a shared IBM360, in an unknown distant location, paying a “time-sharing” cost that varied by time of day. . .

The cloud industry is still quite new. For simulation to leverage the full benefits some cloud CPU providers need to get more innovative in the way they price (for example some sell a minimum of 1 hour on each machine – which we find too large a chunk for the majority of simulation single runs – which are ideal, with many machines running in parallel). It’s also why we’re expanding our range of cloud services so we can give you the best cloud setup to meet simulation your key needs.

If you’d like to find out more about the collaborative cloud project we are working on, or about SIMUL8’s cloud offerings then get in touch!

Leading Successful Manufacturing Projects

$
0
0

Today, managers are faced with many conflicting objectives when attempting to deliver a new product to market. There is significant pressure to launch the product within budget, at a high quality and on time. The “3-Legged Project Management Stool” is an excellent way to describe the balancing act that is required…

The project itself is the seat of the “Three-Legged Stool” and Cost, Quality, and Schedule are the legs. To have an efficient and effective project, you need to have all legs of the stool be equal so there’s no wobbling! If one of these important facets falls short of their respective target the stool falls over; moreover the project fails

Discrete event simulation is one of the best tools that lends itself to all three of these facets, and that is why most large manufacturing companies are using discrete event simulation to reduce risk and keep up with the competition.

Brian Harrington, a former Ford Motor Company employee and SIMUL8 user of 20 years discusses in our latest whitepaper why simulation is such a useful tool for manufacturing organizations to use to ensure the success of a project, and over the next few weeks we’ll be looking into this further on our blog and highlighting examples where simulation has played a key part in the success of manufacturing projects across a variety of industries.

To Access the full whitepaper simply enter your details below:


;

Name
Email


If you have a manufacturing success story of your own, or examples of difficulties when time, cost and quality don’t come together effectively, then let us know, and you could be our next guest blogger!

Simulation vs. Spreadsheets for Process Modeling

$
0
0

There are common reasons against using simulation as a method of process modeling and instead users favor spreadsheet modeling. There are a range of advantages of simulation and many ways to improve accuracy in analysis through the power of simulation…

In this video I talk about the advantages of simulation over spreadsheets over a range of areas including:

  • Variability
  • Resources
  • Animation
  • Pathway Dependencies


When working on simulation in excel, for example, there are limitations – many of which can be addressed using simulation software. In my experience, most of our customers have benefited from the visual aspect of simulation at presentation stage. When demonstrating to stakeholders it is important to be clear and concise and with SIMUL8 we are able to view the process in a more “user-friendly” way. By simply showing a big matrix of data or charts we limit general understanding of the process.


Simulation allows us to communicate changes effectively and can encourage stakeholder buy-in before any changes are made to the real system. Generally, once organizations have witnessed the benefits of simulation modeling they quickly move from spreadsheets to simulation.
 

To find out more about why simulation could be effective for your organization sign up for our whitepaper

 
Name
Email
Company

#SimulationSolves – No More Summer Queues!

$
0
0

Do you want a summer where you don’t have to queue for attractions? Simulation can help make that happen!

Ski resorts are not just for winter anymore! Most of today’s ski resorts are open during the summer months for outdoor activities such as: hiking, mountain biking, zip-lining, and alpine sledding. One of the fastest growing outdoor activities on the mountain slopes is the zip line. A typical zip line course consists of several zip lines; starting with a learning line and advancing to longer, higher, and faster lines.


As the popularity of zip-lining gains momentum, so does the expansion of activities, including additional zip lines. This is where simulation can aid within the layout and operational aspects of maximizing your summer fun, along with protecting the resort’s costs and revenues.


Zip Line Layout & Operational Procedures

A typical group consists of 12 “flyers” or “zippers”. Each group will have 2 dedicated guides, assuring zippers’ safety and zip line protocol. The group starts off with signing waivers and weighing in. Once zippers have been properly fitted with harnesses and trolleys, they are then instructed to watch a 15 minute instructional video.


Maximizing zip line experience and assuring a safe and fun outing does not happen by chance. Setting up a course that spans over 100 plus mountainous acres and contains over one mile of zip lines requires a lot of upfront planning. Our example zip line course consists of 7 unique runs that range from the 100 foot training run to the 1900 foot Adrenaline line. The seven line zip course will include some hiking including a chair lift ride as well, therefore, the course needs to be laid out with a logical hiking trial with timing in mind.


It is important assure that all the operational procedures are in place to maintain flyer satisfaction for 2.5 hours to conquer all 7 zip lines. There are several questions to determine the best way to deliver and maintain flyer satisfaction.


Screenshot of Simulation


Simulating Zip Lines

The simulation model contains all of the pertinent data to predict realistic results. The input data sets include user profiles for a typical group of 12 flyers. Random groups are automatically generated, each flyer will have a unique attribute profile including their weight.  The weight is a significant factor effecting the maximum speed on each respective zip line. The lighter flyers may have trouble making it to the landing platform. For example the 500 feet long line and has a slight upward approach. Here lighter flyers will be instructed to stay in the pencil position to maintain their speed for the landing entry. If they fall short of making it to the platform, the bottom zip guide will throw them a rope and pull them on to the landing platform. This detail has been included within the simulation. That is why we will see a larger range for the time it takes an average group to complete the 2nd zip line.  The model contains user defined algorithms to dynamically adjust the flyer’s speed according to their body weight and flying position. There are three main sectors of a lines speed logic: Take Off, Middle Speed, and Landing.


The Results

We can look at all of the individual flyers’ statics per flight, however, it is more useful to see the group’s overall figures. The below graphs represent the total time for a group to complete a specific zip line in minutes. It shows an average time of 15.9 minutes for the training zip line, 18.7 minutes for the 2nd, and 21.0 minutes on the 3rd  zip line. The model was run for a 2 week period, Monday – Sunday, with operating hours from 8:30am to 4:30pm. Therefore, there were 156 groups that headed out to the lines – an average of 11 groups per day.


graph-completion-time


The next important topic was addressing the average time a flyer waits before their turn. The queue time typically has a direct correlation to customer satisfaction in most business situations. People do not like waiting in lines, so consideration was engineered into assuring acceptable waiting times. The below graph shows the wait times for the 2nd zip line with an average of 9.4 minutes to fly, and 8.9 minutes to wait for the remaining group.


ZipResults Wait times


The next related consideration was ensuring that another group will not catch up with the group that is ahead of them. This situation would cause unacceptable delays, waiting for the group ahead to finish and vacate the platform. This is where the simulation can address the scheduling of groups, and setting up an optimal schedule for the day. Within the simulation we can set up broadcast points at various locations to signal when to send out the next group. Then we can examine how much time has elapsed between the “next group” signal. In this particular scenario of 3 zip lines and a chairlift ride; the optimal signal was after completing the 2nd zip line. Therefore, the next group to hit the training line will be after the group ahead has completed their 2nd zip line. This schedule allows for up to 11 groups per day, with minimal chances of interfering with one another. It was also determined that a group can complete the 3 zip line course within 90 minutes. Therefore, in theory, the resort’s paired zip guides could handle 5 groups within a shift. Although, they feel it’s best to allow for additional fresh zip guides, thereby sharing other duties such as organizing and maintaining the equipment. This also spreads the fun factor for the zip crew staff, ensuring that each zip crew member can also enjoy the outdoors.


Lastly, the simulation included the “Bad Rock” chairlift. All of the chairlifts were existing lifts that are used during the winter ski season. The Bad Rock Chairlift takes people 1,627 feet from the Base Lodge and climbs up 461 vertical feet. The location and elevation gain of the Bad Rock chairlift was ideal for setting up additional zip lines with spectacular views, speed, and range. This is where the 1900 ft, 300 ft high Adrenaline Line is located! The chair lift carries 2 flyers per chair, and takes around 5 minutes to reach the top. Usually, flyers are talking and having fun, so you will often see empty chairs between pairs. This is not a problem, and has been accounted for within the simulation. The chairlift requires staff chair operators at the load and unload points during operation. Therefore, the question was “How often will the lift be running”? The simulation results show that the chair lift will be moving 15% of the time. The remaining time it can stop and wait for the next group to arrive, which will be within 40 minutes.


As we can see simulation studies are not just useful in manufacturing applications. This is a great case study that uses most of the sophisticated tools at hand to assure a safe and fun experience for the 1000’s of flyers that will hit the slope for some summer fun! The resort was able to conduct “What If” analysis as they expanded their operations to include future zip lines. They were also able to examine future demand increases and scheduling of their internal zip line crew. It goes to show that simulation can take you to the peaks!


Want to try it out?

Download the model and see if you can improve the zip-lining experience.

Don’t have SIMUL8? Get in touch to request a trial.

If you have a question you’d like to submit for #SimulationSolves then get in touch


Please note the above case study only is depicting 3 Zip Lines. The actual study included all 7 Zip Lines.

Success Stories at Chrysler

$
0
0
The Chrysler simulation team have been using SIMUL8 for many years to improve throughput, increase revenue and reduce costs. Recently, the Chrysler simulation team wanted to find out what was required to increase throughput at the Brampton Assembly Plant and Jefferson North Plant and how they could achieve this with SIMUL8.


Increasing revenue by $1m a day without increasing costs at the Brampton Assembly Plant

Chrysler expected an increase in demand and the plant was to increase its daily rate from 930 to 969 units to ensure that the demand could be met.

By meeting the increased throughput target the plant was able to increase revenue by $1,000,000 per day.


Download Case Study

Chrysler saved $250,000 by taking the guesswork out of capital investment at the Jefferson North Plant

Chrysler’s simulation team was tasked with finding out if an additional 15 Clamshell carriers were required to increase throughput.

The simulation confirmed that the line was not short of of Clamshell carriers which helped confirm that Chrysler did not need to invest in new equipment.


Download Case Study


Have you had success using SIMUL8? If you would like to share your story with us please get in touch


Do Self Checkouts Reduce Queue Time?

$
0
0

Most of us have probably seen “Self Checkout Lanes” at supermarkets and some retail stores such as Ikea, Walmart, and Home Depot.  But do they reduce overall queue time? We use simulation to find out if self checkouts are really improving customer experience by reducing waiting times, or if they are slowing down the whole process.


What we can see from the simulation – available to download below – is that if more customers in a store have a better understanding of how to use the self checkouts then the average queue time decreases. However, in a store that would have a less “savvy” demographic we would see queue times increase dramatically as customers would be more likely to join the manual cashier queues. This simulation can help a store decide if they should invest in more self checkouts or more manual cashier lanes. Why not try it out for yourself?


Recent statistics show that self checkout systems in the retail industry are becoming more and more mainstream. According to a 2014 study –  with a sample of 2800 consumers from around the world – 73-94% of consumers are using self checkout lanes. As you may suspect the 94% range consists of younger people aged 18 to 34 years, with the 65+ group at the 73% end of the scale*.


The survey definitely supports that the majority of us are using this technology largely irrespective of age. Most of us consider using the self checkout lanes in hopes of reducing our waiting time at the manual cashier lanes. Retailers are attempting to gain higher profit margins by increasing customer satisfaction and allowing cashiers to perform additional tasks while customer queues are low. As more and more retailers join the self checkout race their operational teams will be facing several new questions from upper management.


Typical questions from upper management:

  • How many self-checkout terminals should we purchase?
  • Can we reduce the number of cashier registers?
  • How many cashiers do we need per shift?
  • What is the average wait time on a self checkout terminal?
  • What is the average wait time on a cashier checkout?
  • What will the new wait time be at our existing cashier registers?
  • What range of demand will our self checkout terminals support?
  • What is the ROI for purchasing self-checkout terminals?
  • What is the average number of shoppers in store?
  • Can we meet our internal goal of an average of 1.2 customers per line?
  • What is the utilization of cashiers at register?


Queuing Theory & Simulation

Most of these questions fall into the realms of “Queuing Theory”; but they become increasingly complex to solve when we include human perception, which drives acceptance and usage. We might have access to several surveys depicting self-checkout data per multiple demographics such as age, race, sex, etc – but the most effective way to apply queuing theory is in conjunction with a simulation model. All of these customer profiles can be included within the simulation where we can assign a label to the customer as an attribute (“lbl SCO Savvy”). This represents how savvy a particular customer is about using a self-checkout terminal.


All of the above questions can be answered through the below simulation model which is available to download. The simulation captures a typical retailer’s shop floor and checkout process. This store has an average of 133 shoppers at any time, uses 8 cashiers, and has just recently installed 5 self-checkout terminals. The store historically had an average queue line of greater than 2 customers per register; which included a designed (15 items or less) lane.


Simulation leads the way

Do Self Checkouts reduce queue time? In a store where customers know how to use the self checkouts (“SCO Savvy”) we can see that yes, queue time decreases. Try the slider for yourself where if the percentage of “SCO Savvy” consumers drops we will see a much higher average queue time and vice-versa. As we know in real life, different stores have different types of consumers so why don’t you look at your store and see if it has enough/too many self checkouts based on consumer demographic?


At SIMUL8 we have seen several supermarket and grocery store chains such as Kroger successfully use simulation when applying queuing theory to their shop floors. As this technology expands into additional retail segments such as department stores and convenience stores, simulation will likely lead the way!

If you would like to find out how we helped Kroger in a real life situation please get in touch


Want to try it out?

Download the simulation and see how you can improve the shopping experience!

Don’t have SIMUL8? Get in touch to request a trial.

If you have a question you’d like to submit for #SimulationSolves then get in touch


*http://www.statista.com/statistics/326353/global-usage-and-non-usage-rates-of-self-checkout-by-age

Managing Bed Capacity Towards a Solution

$
0
0

Sign up now to watch our webinar on Thursday August 27th, 11am (ET)

About the Workshop

It is estimated that better bed management can save approximately $1.8million a quarter per hospital and give patients better outcomes.

Join SIMUL8 Director of Healthcare, Claire Cordeaux, for this month’s Healthcare Workshop and hear about her experiences of working with healthcare organizations to manage hospital bed occupancy effectively using simulation.


Name
Email
Company


Plus find out about how we’ve been working with healthcare organizations around the globe to develop a new solution to manage bed capacity. From preventing delays to ensuring patients get to the right bed and receive great care – this simulation tool will give you the ability to experiment freely and plan confidently.
Bed Modeling

Is Your Contact Center Capable?

$
0
0

Most of today’s retailers have some sort of contact center department which supports customer service and sales. This is not surprising with the shift of customers shopping via their home computers and smart phones. Retailers now need to ensure their contact centers are capable to compete within this multi-channeled world.


Agents must be able to take service and sales via phone, email, online chat panels and even social media. As greater emphasis is placed on the contact center, it becomes ever more the critical factor to delivering the company’s reputation, achieving projected sales and meeting customer satisfaction. This is where a simple simulation model can provide key insight into the design and operational effectiveness of your company’s contact center.


Why Simulate your Contact Center?

As customer demand increases and shifts towards multi-channel capabilities your company might be faced with an outdated contact center structure.
The dilemma remains the same: calls come in and must get handled within an appropriate amount of time. The difference is that there might be greater volume and that this volume might come from various contact channels. This is why many companies are revamping their analogue contact center departments and internal processes with digital routers.


Despite these changes most of the performance metrics, such as inbound volume, service level, abandonment, agent occupancy, and average answer speed amongst others, remain the same. With this change in customer shopping habits, upper management should be asking these questions:

1. Is our contact center capable of multi-channel orders?
2. What is our priority when it comes to multi-channel orders?
3. Do we need more agents with additional contact channels?
4. What is our current contact channel volume?
5. What is the trend via contact/order methods?


Let’s take a look at a typical contact center that might be widening its multi-channel usage. We will start with an example of a retailer with an online catalog currently using 5 to 8 contact agents. The agents are capable of servicing customers and taking orders via phone, email and through online chat panels. All forms of contact methods can be categorized according 1 of 4 types of contact: New Orders, Order Status, Returns and Questions. For example, when you place a phone call you often get a recorded message specifying such a menu which categorizes the call. Utilizing a digital router it is possible to have categorized queues feeding each contact channel.


In this example we have two routers sending contacts to agents; one designated for email and the other for phone and chat panel communication. Therefore, we can prioritize how contacts are handled by respective agents. We might place phone calls ahead of chat panel communication, which in turn is considered higher priority than emails. Knowing your company’s internal performance metrics will definitely help identify the design of the priority scheme. For example, the desired Level of Service might be that 80% of calls and chat inquiries are answered within 1 minute and within a working day for emails. This metric is closely related to abaondonment, where the customer drops the contact inquiry if they are waiting too long.


Design an Efficient Multi-Channel Contact Center with Simulation

Like with most simulation models we start with the process. Most contact center’s overall processes are quite straightforward. Contacts, in the form of new or existing customers with a specified type of inquiry, enter the system upon a certain arrival rate, such as an exponential distribution, or through an internal empirical dataset. In our simulation (see Figure 1), these contacts arrive either via phone calls or online. The categorized contacts then can be queued and routed to agents upon various conditional statements.


Figure 1 – Contact Center Simulation Model


Each agent, or group of agents, might follow a certain set of operational guidelines (an Agent Flow Chart) for handling different types of contacts. These can follow a complex set of process flow patterns to enable the modeling of Skill Based Routing. In our case study simulation they are captured within a unique sub-window for each contact channel with all agents handling all types of contact. As we can see from Figure 2, questions can be routed back as new orders capturing the agents’ unique ability for making sales over the phone. Finished contacts are then either routed to the warehouse or to the appropriate “Work Complete” object to track and collect vital statistics on the volume of each individual contact type.

Fig2

Figure 2 – Phone Process Agent Flow Chart


Fig3

Figure 3 – Agents On Shift Dialog Box


In this simulation we can also readily change the number of agents via a simple user dialog box depicted in Figure 3 to facilitate the testing of varying staff allocation. This is particular can support contact center directors in their Work Force Management and Optimization. The agents assigned work an 8.5 hour shift each day and the contact center runs Monday to Friday and is simulated over the course of 4 weeks. By incorporating further simulation modeling it is also possible to:

  • customize agent shift patterns
  • vary the volume and distribution of incoming contacts
  • designate groups of agents to specific contact methods or types
  • supplement the process with additional contact channels
  • construct specific or more detailed agent flow charts


All of these variations to the simulation can be used to test “what if” scenarios. The results of these scenarios can then in turn be used to perform Call Handling Analysis by comparing the recorded performance metrics. This allows contact center management to hone in on the best use of their agents in order to maximize the contact center’s performance metrics!


Contact Center Performance Metrics

Most of the important metrics can be captured within a table and displayed on the simulation model’s desktop. Below Figure 4 shows the resulting metrics for a 4 week period with 5 agents on duty. We can see that 16,229 contacts came in with a Level of Service of only 75.6%, yielding an abandonment of 24.3%. However, we are exceeding the target of 80% agent occupancy, with an average of at least 122 contacts per day for all agents. Additionally, in the same table we can see the average contact time for each of our agents on shift. We can also dig further into the results and see the statistics per channel, such as the average speed to answer. This shows that the call and chat panel speed to answer is on average about 45 seconds while emails are being attended to after roughly 136 seconds.


Figure 4 – Scenario 1 Performance Metrics


To investigate how we can improve our service level we can now make alterations to the number of agents available on-shift. Our question is: what would the performance metrics look like with all 8 agents working? Using the Set Number of Contact Agents button we can make this change and then simply rerun the simulation. Well… we can see in Figure 5 that our agents are now easily meeting our target with a service level or 93.4%.


Figure 5 – Scenario 2 Performance Metrics


We can compare all of the previous metrics but the key one that we should notice is that the agent occupancy is now not meeting the 80% target. This trade-off is one that contact center management will be familiar with and one that can be further investigated using this simulation model. We invite you to use the simulation to find a suitable balance between Level of Service and agent occupancy by testing different staffing allocations and comparing the performance metric results.


Concluding Thoughts…

Whether your contact center has 8 or 8000 agents the simulation model and analysis would remain similar to the depicted case study simulation. For larger contact centers, analysis could be reported on shorter intervals in the simulation. Most of today’s digital contact center software and routers will provide a vast amount of data that can be easy imported to the simulation. The benefits of providing a simulation is to leverage the data at hand and dial-in your contact center algorithms and improve the utilization of your agents.


The simulation can enable the contact center team to stay ahead of the curve when it comes to maintaining customer satisfaction. As multi-channel ordering dynamics continue to evolve and change over time, it’s important that your contact center reflects what customers are demanding with respect to placing orders.


Want to Try it Out?

Download the contact center simulation.


Don’t have SIMUL8? Get in touch to request a trial.


Learning Points

Explaining how we use Exponential and Poisson Distributions when it comes to contact arrivals

LearningPoints

There often is confusion on which distribution to use for incoming contacts which often follow a “Poisson Process”. We actually use the “Exponential Distribution” for the inter-arrival times within our “Start Points”. This distribution is actually the time between events within a Poisson Process. If we were to take some time interval such as an hour and actually count these events we would come up with a discrete value. If we collect all of these counts for the duration of the simulations run it would fit a discrete Poisson distribution. Theses counts are captured within the spreadsheet “ss_Ph Call Counts Poisson” and can be imported into Stat::Fit to build and visually display the distribution of the arrivals.

CTO Blog – Why SIMUL8 2016 Will Surprise You!

$
0
0

It’s a real release.

10 years ago I received an email from a customer who had been with us almost since we started in 1994. His email was praising our latest release, there was one phrase I’ve never forgotten “it’s a real release”. It was the best feedback I could have gotten, the features added value to him. Since then that has been our goal with every release of SIMUL8, to ensure we always make a “real release”. No token releases for the sake of it.


That’s why you have to upgrade to SIMUL8 2016 because yet again it is packed with meaningful features that step change the user experience and help draw insight from your simulations. Perhaps most exciting of all, it’s full of features that will surprise you!


It will surprise you.

What’s going to surprise you? It’s the features you didn’t ask for. Even though you didn’t ask for them they’ve been inspired by you, by seeing how you’ve already stretched SIMUL8’s features using them in ways we never thought they could be. They’ve been imagined from listening to you when you were frustrated that there was a key point you couldn’t get across in your simulation to your stakeholders. They’ve been conceptualized by listening to your dreams about wanting more people in your organization to see the value that simulation adds, by wanting people other than yourself to use the simulation and engage with it to gain insights of their own.


Surprise spoiler

Now I’m going to ruin the euphoric pleasure of discovery, a wonderful feature you never knew existed (I am a geek I understand this pleasure so I apologize). My favorite surprise features in SIMUL8 2016 are:

  • UX interface engine
  • Dynamic run time insights


UX Interface Engine

Eh, that’s not on the feature list? I know, everyone else will be calling it “Tabs and HTML Dialogs”. That is the features yes, but the power of those two features combined is to create an interactive, feature rich, polished web based interface for your simulation. It’s the power to turn your simulation from a decision analysis model to an interactive web based user application; in fact, you could even sell it as your own simulation product!


It’s so easy, no developers involved. That was the goal; let you turn your simulation into apps. We’ve been making simulation apps for years. We use a developer – that’s fine for a big software house like us but not for most of you working in your process improvement team. The dream was to give you the power to make simulation web tools, developer free, and we did it, and it’s easy!


You tick a box to add some tabs to your simulation window. Call them what you want, for my simulation applications I always go for 3 simple tabs “Inputs, Simulation, Results”. I like to use my tabs like wizards that guide the user through the steps they should take. Then say what action each tab will do, open a spreadsheet, open a custom report or… open a custom dialog, which now supports HTML.


It’s that crucial last feature that brings the power. We’ve made special tags that will support any SIMUL8 variable, or spreadsheet, but then you use the HTML to make it look exactly how you want, you have total freedom. Now I know not everyone knows HTML but trust me it is so simple to learn, it’s the language I started on years ago at college to teach myself coding, by the end of day 1 I was flying. If you can code Visual Logic, you can code HTML standing on your head!


Then share your simulation in our private Web Portal tool or use YouSIMUL8.com and now people can use your simulation in the web in a custom fabulous UX designed by you. That means anyone in your organization can see and use your simulation.


Dynamic run time insights

Again, not the title on the feature tour. On the feature tour it’s “bar charts” and “custom queue colors”. This is us doing what we do best, using run time animation to provide meaningful results. One of my biggest bugbears is people who say animation is just for sizzle; done right animation should be a result in itself. I never add animation that doesn’t deliver insight, if you do that it just clutters and distracts. That’s why I’ve never believed in 3D – if the world was simple enough to look at and solve the problem you wouldn’t need simulation. Sorry rant over, back to the point – animation for results insight.


Custom queue colors let you change the color of the queue based on conditional criteria, average time waiting, average contents etc. That means you can have a traffic light system warning of queues you should be paying attention to, that you might not spot. Maybe a queue always has quite a low content, so it never appears to be a bottleneck, but actually the work items in there have a really long average waiting time, so there is a problem there.


Yes you could get this from going through the numeric results, although you could miss that it only happens during specific time periods because you’re looking at overall average performance, so then yes you could record average queuing times over intervals and go through the hundreds of lines to spot the periods where it goes wrong. But why bother, why not just run your simulation, watch the animation and see the queues turn pink, then without any data trawling your attention is alerted to periods you need to investigate.


Run time bar charts deliver the same opportunity, to see performance change over time, to see the dynamic behavior over time. It is a special kind of insight that only simulation can truly deliver.


How will you use these?

What will be the biggest surprise is how you will use these and the many other features SIMUL8 2016 is packed with to deliver insight. I am looking forward to seeing the inspirational simulations you will create with SIMUL8 2016. Please send me your simulations, or call me to chat simulation. Chatting to you is the best part of my day!


You have inspired us to think outside the box. Thank you for being our inspiration for SIMUL8 2016.


frances_sneddon-150x150Want to chat simulation? Get in touch!

Frances Sneddon
Chief Technology Officer SIMUL8 Corporation
frances.s@SIMUL8.com
@FrancesSneddon


Using Overtime for Processing Work

$
0
0

With our new Overtime feature the simulation clock realistically adjusts to the state of the system.


Watch our video as Tom, one of our simulation consultants, shows you how to use the new overtime feature in SIMUL8 2016.

 
Using Overtime you can now quickly extend working hours until all vital work has been processed while disabling the arrivals process of additional work. Once your process has run into overtime you can filter results to segment performance across operating hours and effective overtime hours while viewing the overall performance of the whole system. These exciting new results can be the key differentiator of a struggling system and a successful system.

 
Find out about all our new features available in SIMUL8 2016


Launch & Grow a Successful Simulation Program

$
0
0

Lance Millburg, Senior Lean Six Sigma Project Manager, talks us through how Memorial Health System built their simulation team from the ground up into a nationally recognized program in 2 years.


In this webinar we hear about Memorial Health System’s five step approach to developing stakeholder buy-in, building the necessary training infrastructure, and getting exposure with strategically selected projects.

Gain lots of practical insights useful for individuals who are just getting started, as well as those who are established and looking to grow their simulation program and increase their impact.

Webinar highlights:

  • Step One: Give Them a Taste (3:47)
  • Step Two: Learn The Tool, Build on Success (10:00)
  • Step Three: Engage Your Stakeholders (18:31)
  • Step Four: Build Standardization and Clarity (29:44)
  • Step Five: Ramp It Up (37:33)
  • Additional Models Ideas (46:25)
  • Q & A (52:24)


Watch the Recording


View Webinar Slides

We hope you enjoy the webinar. If you’d like to find out more about Memorial Health System’s work using SIMUL8 please get in touch

Tabs & HTML Dialogs in SIMUL8 2016

$
0
0

We’re really excited to introduce a new feature to SIMUL8 2016 helping you to create an interactive, feature rich, polished web based interface for your simulation.


With this exciting new feature now SIMUL8 users have the power to turn simulations into powerful web-based user applications. Select a tab to open dialogs, custom reports and spreadsheets within the simulation window. Dialogs can now be linked to an HTML file that controls all the formatting and layout of the dialog you create. Used together with tabs you can create beautiful looking data input screens and results dashboards!


Find out about all our new features available in SIMUL8 2016


SIMTEGR8: Simulation To Evaluate Great Care

$
0
0

Live webinar: Using simulation to help reduce emergency hospital admissions.


Hear from Cheryl Davenport, Director of Health and Care Integration at Leicestershire County Council, about how simulation is helping to evaluate how emergency hospital admissions can be reduced.


Find out about the fascinating collaboration between Leicestershire County, SIMUL8 Corporation, Loughborough University and Healthwatch Leicestershire and their challenge to reduce emergency hospital admissions – and learn how they used simulation to evaluate the effectiveness of new integrated care interventions.


Join the webinar on July 29th to see the simulations in action and to find out how simulation is helping to work towards a fully integrated service provision – with people at the center of the services that Leicestershire delivers.


Join the live webinar


Video Overview: Conveyor Functionality in SIMUL8 2016

$
0
0

SIMUL8 2016’s conveyors have been re-designed to accommodate industrial applications that demand a high degree of versatility.

 
Watch the overview video below with Ken Doole, SIMUL8 VP of Customer Relations, and Glenn Holburn, Support Specialist, to discover more about the new conveyor updates in SIMUL8 2016.


Make risk free decisions rapidly, accurately and efficiently with SIMUL8 2016.

SIMUL8 2016 is here, giving our users more power, flexibility and efficiency than ever before. We’ve worked with our users and expert consultants to deliver great new features helping you to build intuitive simulations and get results fast.

Learn more about the exciting new features available in SIMUL8 2016

Doing More with Less – Mastering Mixed-Model Assembly with Simulation

$
0
0

2017 blog header


Automotive simulation expert Brian Harrington explains why tools like SIMUL8 are key to the successful implementation and ongoing performance of mixed-model manufacturing systems.

Watch the ‘Balancing Mixed-Model Assembly Lines with Simulation’ webinar for more details and learn about how SIMUL8 is used to design, launch, and improve automotive production programs.


Why is mixed-model assembly on the rise?

Today’s manufacturing lines are tasked with being more flexible to maximize profitability and efficiency. To help meet this challenge, many manufacturers now utilize mixed-model assembly. This is where a group of products are produced on the same assembly line, without long delays to change tooling.

Such assembly lines improve production flexibility, help meet the increasingly diverse needs of customers and reduce the duplication of costly resources.

It’s particularly prominent in the automotive industry, where the idea of a dedicated plant to manufacture one vehicle type is now a thing of the past. With advances in manufacturing tools and technology, today’s assembly plants are more capable of producing a family of vehicles.


“By 2017, Ford will increase its global flexible manufacturing to produce on average four different models at each plant around the world to allow for greater adaptability based on varying customer demand.”

Source: 100 Years of the Moving Assembly Line, Ford

Ford


What has led to the growth of automotive mixed-model manufacturing?

With vehicle programs costing billions of dollars to develop and launch, OEM manufacturers and suppliers are continually looking at ways to maximize efficiency to increase profitability.

The rise of mixed-model assembly can be attributed to a range of factors:
 

  • Shorterning vehicle development times: product and manufacturing engineers are facing increasingly shorter timescales to launch vehicle programs.
  •  

  • Increased, global competition: we are trying to beat an increasing range of competitors to market, with narrowing profit margins.
  •  

  • The need to exceed customer expectations: customers need to be satisfied by delivering high-quality products, within a reasonable time after placing their order.
  •  

  • Being flexible to changing customer demands: producing a family of products is key to satisfying the changing needs of customers, as well as meeting the increasing desire for mass vehicle customization options.


Implementing flexible manufacturing successfully using simulation

When we look at manufacturing multiple vehicles in one facility, there can be conflicting objectives:

  • We are trying to cut costs
  • We want to reduce the overall time to market
  • We are aiming to produce the highest quality product possible

As you can see, manufacturers are really tasked with doing much more for less. These competing objectives are often why simulation tools like SIMUL8 are utilized as they provide the evidence needed to reduce risk when implementing effective mixed-model manufacturing facilities.

Although mixed-model assembly has many advantages, it can increase the complexity of plant layout, logistics, and material flow. Simulation provides us with the means to prototype and test these elements to ensure that a plant has the capability to optimize inventory levels, lead times and resource utilization.

Conflicting objectives


5 ways simulation can support mixed-model manufacturing planning

Discrete event simulation is a computer-based model that mimics the operation of any real or proposed system. Software like SIMUL8 enables you to easily visualize manufacturing processes. You can then quickly measure, test and experiment with any changes to your processes in a cost-effective, risk-free environment.

With the added ability to import our real-life assembly line data, simulation allows us to accurately model all the considerations, complexities, and variance involved in mixed model assembly, including:


1. Identifying and optimizing takt times / cycle times
Lean, mixed-model assembly lines are optimized to customer demand, especially the takt times needed to produce the right product mix within the right time.

Going far beyond what we could handle in precedence diagrams, simulation allows us to easily consider the effect of factors like shared resources across different processes or vehicle types, with each having unique cycle times.


2. Discovering the right product mix and scheduling scheme to maximize throughput
Similarly, we can set up and analyze different ‘what if’ scenarios and adjust our product mix accordingly. For example, producing these in a blend, a random fashion or in small batch sizes.

Simulation can test these approaches to identify which has the biggest impact on jobs per hour/overall throughput. Even an increase of half a job per hour could make a huge difference in profit!


3. Accounting for the impact of downtime, changeover times and tool set-ups
With simulation, we can use exponential and erlang distributions to calculate downtime and repair times for every task, or at station level across the assembly.

We can also do this for any changeovers and tool set-ups, so every time a different vehicle type travels through an asset that might require a tool setup or changeover; this will be accounted for in the simulation.


4. Proving the impact of new technology or flexible tools to build a business case for investment
As well as identifying where existing machinery is causing bottlenecks due to factors like changeovers and tool setups, simulation can be used to make a business case for investment in equipment that can improve mixed-model assembly.

For example, a simulation could prove the impact on cycle times of introducing a flexible tool with multiple faces; where instead of doing a full changeover, the table would rotate for each vehicle type. Rather than relying on AutoCAD layouts, spreadsheet calculations or even basic whiteboards to work through this process, a simulation can run comprehensive scenario testing in a very visual way. This allows your stakeholders and board members to see the impact of investing in new production tools and technology for themselves.


5. Comparing different routing options
Similar to above, we can test whether the manufacturing process might benefit from having a dedicated weld table for each unique product type, to completely eliminate changeovers and tool setups. Simulation can answer questions like ‘If we use parallel machines, will the sequence to get out of sync with late vehicles? Do we release one when one has a longer cycle time? Do we maintain the cycle time?’.

We can run mixed products through these routing decisions and from our simulation throughput results, we can easily identify whether or not we are going to meet the target value.


Learn more about how simulation software is used by automotive manufacturers

From these examples, we can see how simulation has become an invaluable tool for planning, testing and implementing mixed-model assembly processes.

With the ability to run an entire facility in a simulation environment, manufacturers can easily and quickly conduct ‘what if’ analysis to get the answers they need to maximize throughput in a cost-effective environment.

Take a look at our resources below to learn more about automotive simulation, or contact a member of our team to arrange a demo of SIMUL8.


Balancing Mixed-Model Assembly Lines webinar

Brian Harrington explains how simulation tools like SIMUL8 can support flexible automotive manufacturing and mixed model assembly.

Watch webinar

Example Automotive Body Shop simulation

View an example simulation that demonstrates the typical objectives of designing and running a flexible and efficient automotive body shop.

 
View simulation

Automotive Manufacturing Simulation Guide

Learn why simulation is used throughout the life of an assembly plant; from design, to operational aspects and continuously improving performance.

Watch webinar

4 ways to improve laboratory workflows with simulation

$
0
0

Managing an efficient, cost effective laboratory is the goal, whether in life science research, pharmaceutical manufacturing or as part of a hospital system.

Clinical laboratory bottlenecks can quickly impact on an entire hospital system, affecting costs, length of stay, and patient outcomes. Inaccuracies can be costly and adversely affect patient care. But making any changes to laboratories to improve their efficiency usually involves substantial investment and potential risks. How do you know which is the right approach to take?

At SIMUL8, we have seen a growing number of our healthcare and life science clients applying simulation to help them safely and accurately understand how laboratory alterations will impact performance.

In this blog post, I’ll show you examples of how simulation has been used to answer a wide range of questions around:

  • Introducing new machinery – how will it be utilized, how is it going to affect the whole system and what will the ROI be?
  • Optimal layouts – what will the impact be of changing or redesigning the layout of a laboratory?
  • Demand changes – what would the impact be of an increasing number of samples that need to be tested?
  • Total lab automation – how can we test the benefits of this approach before investing in equipment?
  • Hospital flows – how can we ensure that patient results are processed quickly and avoid bottlenecks?


What are the benefits of using simulation?

Visualization

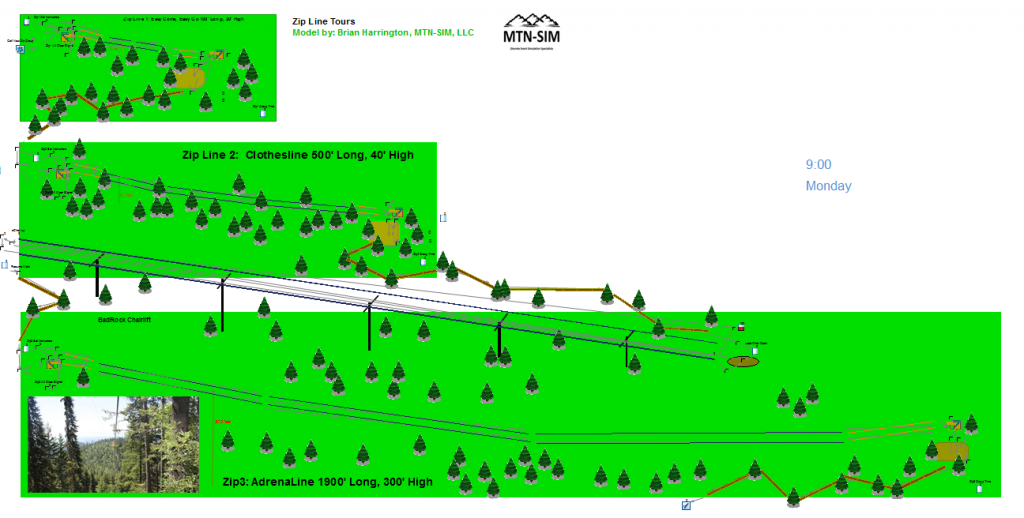
You can build a simulation to look just like your existing or proposed laboratory system. Many of our users import their own floorplans in to SIMUL8 and build the simulation on top. As the simulation looks and behaves like the real system, this helps to easily understand what is going on and see where any queues or bottlenecks are building up.

Sharing simulations with colleagues also helps to improve engagement and communication and guides stakeholders to ask the right questions when assessing improvement options. You might even find that you’ll uncover the solution to your initial problem before you even have the results – just from the conversations that simulation encourages!

Capture real life variability

Simulation incorporates the variability that happens in the day-to-day running of a laboratory. Just as patient flow in a hospital varies throughout the day, laboratories will have more samples across different times of the day. If you have a larger, more central lab, you might also have deliveries of bulk samples at a certain time.

SIMUL8 allows you to easily capture this variation, enabling you to get a more accurate representation of how a laboratory will be impacted by changes.

Simulate complex logic and rulesets

We can include complex logic and rulesets in the simulation. For example, you might want to assess how many samples should be loaded into a machine before it starts to maximize efficiency.

Just because a machine can load 100 samples at a time, should you do that? What happens at the end of the day, or at the end of a staff shift? All of these rulesets can be incorporated.

Tasks like resampling can also be included. If a certain percentage of samples have to go round the system again, and we know that they vary by sample type, we can incorporate all of this information in the simulation.

Encourage whole systems thinking

With laboratories, it is essential to look at the system as a whole when making changes. If we are building a laboratory and are looking at introducing a new machine, it can be easy to focus on how that machine will work, how many samples it can process, and what the waiting time for that machine will be.

However, if we are implementing that machine to remove a bottleneck in the process, it could be that we are actually pushing that bottleneck elsewhere, so the system as a whole might not improve at all. We can help illuminate these issues by simulating the whole laboratory or hospital system, tracking results throughout such as throughput and time in system.

How is simulation used to improve laboratory flow?

1. Assessing the impact and ROI of new machinery

One of the most common uses of simulation is to understand the impact of introducing new machinery. Whenever you are changing a lab there are different types of equipment, brands to choose from and costs to consider. New machinery can be a big investment, so it is important to know the true impact it will provide ahead of that investment.

We see many SIMUL8 users who are using simulation to assess the return of investment of adding new equipment to their system. On the other side, we also have users who use simulation to demonstrate the benefit of their equipment. Showing potential customers how new equipment will improve their process really helps to show the real life impact of implementation.

Simulation helps to answer a wide range of questions around new machinery:

  • What will be the impact on waiting time?
  • How utilized will the machine be?
  • How many more samples can we process?
  • Will the machine create or move a bottleneck?
  • How can we make the system work well with the new equipment?
  • How will it impact time in system and results against targets?


2. Total or partial lab automation

You can also take this further and look at the impact of total or partial lab automation using simulation. As technology improves, there will be more and more incentive to move to automation.

Automation can deliver a wide range of potential benefits for laboratories – including faster, more accurate results for the patient and more reliable results through the removal of human error. Automation of tasks can also allow staff to focus on more interesting, valuable work, without the need for them to work on repetitive tasks.

Using simulation, you can assess the impact of total or partial lab automation: how will the speed of results improve? How is it going to impact our staffing requirements? Although automation involves a large initial investment, simulation will enable you to identify the long-term benefits – for example, what would be the cost savings of not having to do as much rework?

An example of using simulation for laboratory automation
An example of a SIMUL8 client who is working on this type of project at the moment is Sysmex, a producer of an innovative track system where samples move around the lab in small cars.

Sysmex have utilized simulation to demonstrate how this track system can improve a laboratory process and how it can translate across small, medium or large labs.

Sysmex track system

3. Different layouts, demand patterns and outsourcing

Next, we can look at the impact of different laboratory layouts and demand patterns with simulation. As more organizations seek to improve cost-effectiveness, there is an increasing interest in identifying ways to make labs more efficient.

You can simulate changes like the expansion of an existing lab, moving the location of the lab in a building, or reconfiguring machines. The simulation can also identify the impact of varying demand on those changes – what will be the limiting factors, which part of the process is going to be my bottleneck?

With any of these changes, you can use simulation to get evidence that the laboratory will be able to meet targets.
An increasing number of healthcare organizations are also outsourcing laboratory work to external suppliers. Although this might save on costs, if the laboratory is based elsewhere it could potentially increase the time it takes to get samples back to patients. Without knowing that in detail, it can be difficult to make a confident decision on outsourcing – that is where using simulation can really help.

Testing laboratory layouts with simulation
A large pharmaceutical SIMUL8 user wanted to understand the effect of positioning an accumulator ahead of a cartoner and to test this new laboratory layout with different throughput rates. They were able to create a simulation to test various capacities for the accumulator and identified which capacity would be most effective if the system was reconfigured.

Pharmaceutical simulation example

Looking at another user example in the hospital environment, BJC HealthCare wanted to assess which laboratory design would be most effective for improving staff movement efficiency and reducing any waste. Here, the simulation results showed that a 37% reduction in travel time could be achieved using layout two.

This simulation also helped BJC to determine the right staffing levels for this layout as they could look at how many staff were needed to operate the machines and also how much time would be spent moving around the laboratory at different times of the day.

BJC laboratory simulation

4. Impact of laboratories on hospital flow

Finally, another common use of simulation is identifying the impact of laboratory changes or improvements on overall hospital flow.

Fast and accurate patient results are critical for minimizing patient wait times or delays throughout any hospital, particularly in places like emergency departments where there are often strict targets in place.

Looking at hospital data, we might only see that a patient has been delayed, but not really be able to know which part of the laboratory process has caused this delay. Simulation allows parallel processing to be tested, isolating the time spent waiting for laboratory test results. Including this in the simulation allows you to see how long it will take for samples to be processed and highlighting the impact of any laboratory changes on patients.

Testing hospital flow example
An emergency department in London, UK used simulation to test a new department design. With SIMUL8, they could incorporate all their different department flows and also include a separate diagnostics pathway. You can see from the screenshot below that this includes x rays, CT scans as well as blood testing.

The simulation also incorporated different patient types, enabling the emergency department to identify the number of samples that would need to go to the lab, understand how long the process would take and identify the overall effect of sample turnaround on patient flow.

Using the simulation, they could then experiment with changes to the system to identify ways to reduce laboratory delays in the department and meet waiting targets.

Emergency department simulation

Could simulation help you?

As we’ve covered here, there are a diverse range of ways that simulation can be applied to test and implement laboratory flow improvements.

Whether you are looking at building a whole new lab with a new layout, or you already have the system and just want to test different machines in different configurations, simulation enables you to answer key questions, measure KPIs and guide implementation.

If you’d like more information about how SIMUL8 can be used for simulating laboratories, take a look at our healthcare and pharmaceutical resources or get in touch to discuss your project.

Improving the supply chain: 3 examples of success with simulation

$
0
0

How robust is your supply chain? Do you have enough storage capacity to cope with sudden changes in demand or problems with a supplier? What about strategy; could you predict how long an alternative supply route will take to setup?

SIMUL8 gives you the tools to answer these questions and to test the reliability of your supply chain in a virtual and risk-free environment.

With process simulations we are able to watch the behavior of the supply chain play out over weeks, months or years in just seconds of real-time. Instead of trying out just one strategy, we can easily adjust parameters and re-run our analysis to explore many scenarios; spotting the best opportunities for improvement and uncovering potential risk areas.

So how do we put this into practice and what might your first supply chain simulation project look like? In this post, I’ll share three examples of how SIMUL8 simulation software has been used on real-world supply chain projects to give you ideas and inspiration for future projects.

If you’d like to learn more about using simulation to guide your own supply chain strategy, get in touch with our team.

1. Dealing with seasons and variability

Winter clothes are four times bigger and heavier than summer outfits; this is something that I learned when developing a simulation with a major clothes retailer.

It was fascinating to me how much influence this simple fact had on the complexity of the supply chain over the winter months; more trucks, more delays, more storage space and even more shopping carts! All of this working on a sliding scale from Miami to Maine, depending on the customer demand for thick winter coats.

Simple models and traditional process improvement tools can be hard to fit to supply chains; a process design that works great for one month may be unsuited for changes that occur just a few weeks later.

As supply chains typically span several organizations and multiple locations, it can be more challenging to communicate and implement improvement strategies, especially when these have a greater vulnerability to external factors such as weather disruption or a shipment being rejected due to quality issues.

SIMUL8 offers the flexibility to simulate both scheduled regular events (e.g. an increase in customer demand in November or day-to-day truck deliveries) and the ability to use random variation to add out-of-the-ordinary or irregular events (e.g. trucks breakdown, quality problems, staff vacations).

Running your simulation many times, what we call conducting a trial, informs us of the likelihood of outcomes. For example, you might ask ‘what if we’re unlucky and get 20 rainy days in a row, how sensitive would our supply chain be to this?’

Planning for seasonality with simulation – an example

A large furniture manufacturer wanted to improve processes around a range of products where 80% of all customer demand lands in November, due to Thanksgiving and Christmas market influence. In the existing state these products were produced all year long, alongside other product ranges.

The manufacturer wanted to know if investing in a new plant would be beneficial by increasing capacity to allow more production to be focused in the preceding quarter before November (e.g. build all of the stock across 3 months rather than 12 months). This could achieve more Just-in-Time delivery and in turn reduce the dependency on long-term storage of stock.

How did simulation impact supply chain strategy?

Experimenting with historical demand data and process cycle times, the manufacturer used the simulation to verify that a new plant would be beneficial to this objective.

To maximize efficiency, further testing found that setting up the new plant to run six lines offered the best fit for the time frames and productions volumes whilst maintaining an efficiency gain over the traditional storage based system.

After running trials on the new system, where SIMUL8 automatically performs thousands of runs, an unexpected issue was discovered. The manufacturer discovered that the average increased output rate from the plant in peak months would require twice the amount of trucks over what had been originally estimated as the capacity of the planned haulage facilities.

Catching this early, the design of the plant was adapted to accommodate a larger loading bay; allowing more trucks to load at the same time, rather than waiting. The simulation also confirmed that even with these extra haulage costs the manufacturer would still achieve return on investment.

2. Sizing an opportunity and getting implementation right

Establishing something new in a supply chain can be a challenge. When implementations fail the most common cause is misjudging the sizing of the operation.

Go too small and the system becomes overrun, customers tire of delays and cash flow can be choked. Over-sizing brings other issues; higher investment, under-utilization of staff and equipment (especially during the ramp-up) and the dreaded overspend.

Using simulation mitigates these risks by making it easy to run tests while adding or removing workstations, storage areas or staff. By adjusting and fine-tuning the resource levels in the system you can quickly gain a better understanding of how the process works under pressure and plan for any constraints or extraneous capacity.

Supply chain sizing using simulation – an example

During a large expansion to a European Shipping Port there were many questions that the local government and investors had to examine and answer. Most critically, the sizing of each part of the process needed to be better understood, including how the expansion would need to be supported by local services and infrastructure.

How did the simulation impact supply chain strategy?

Starting by experimenting with the number of ship-to-shore cranes to install, the simulation helped to explore all areas of the dock operations; container movement and storage (including refrigerated storage), loading to trucks and offloading to smaller vessels.

To ensure the economics of the wider initiative, a number of proposed shipping schedules were also tested; some featured conservative estimates with fewer ships and goods, while others tested for more optimistic predictions where the volume of ships and goods were higher but could cause challenges in terms of shipping lanes traffic and a lack of capacity on the road infrastructure.

The impact of the simulation on strategy was two-fold; firstly a clearer established estimate on the minimum viable volume of ships and goods was calculated. This assisted the management team with their business planning and gave more guidance on the amount of supply work that would be needed to support the venture.

Secondly; a particular process was found to be a major constraint in the system: the offloading of large vessels transferring containers to smaller ships. The simulation supported improvements to this process by validating a new ship loading approach that involved sacrificing dockside container capacity to allow faster crane activity.

3. Heijunka, Kanban and Pull Vs Push – levelling supply to demand

How can we really get smarter with our supply chains? One key component is ensuring the right parts get to the right place at the right time.

JIT (Just-In-Time) delivery and other Lean and Six Sigma Process Improvement principles are often discussed but how do we actually go about implementing these to a modern supply chain?

Levelling supply to demand using simulation – an example

A large distribution center used a simulation to understand the optimum lane size and number of lanes to support the product mix and customer demand patterns and avoid stock out occurrences.

How did the simulation impact supply chain strategy?

Distribution centers play a crucial role in the supply chain, acting as a buffer between customer demand and manufacturing output. Sizing them correctly is crucial; reducing stored stock creates capacity for a greater bandwidth of goods, increasing profits, but if we drop volumes too low we risk stock outs that upset the customer.

The simulation confirmed that the parameters for lane size and number of lanes had the most significant influence on performance. From there, they were able to experiment through trial and error to adjust these levels to best match the customer demand profile. The team were able to identify several potential approaches; ranging from more risky to more conservative options, with all options offering improved performance over the current state.

The simulation supported the design of the distribution center and was also a great asset for communicating the supply chain behavior to suppliers and customers. Work on the simulation also opened up discussion on adding a direct channel from one of the manufacturing plants to the consumer and this option is also now being actively explored by expanding the existing simulation.

Enable your stakeholders to get involved in supply chain improvement

By working with SIMUL8 users on these projects, my take away is that although it can be hard to get everyone on board with a supply chain improvement program, simulation always helps to change this and break out of silo thinking.

There is huge benefit to be found in getting suppliers, customers and managers together in the same room to look at the overall process with an interactive simulation that animates each part of the chain.

Increasingly, we also find that even when teams start off using simulation as a silo tool, exclusively to drive in-house process improvement projects, they quickly realize that sharing their simulations with their customer is a very effective means of communicating with stakeholders and for boosting their bidding process.

One SIMUL8 user, a tier 1 supplier to the North American automotive industry, explained the benefit of using simulation to me:

“Our normal entry to the bidding process was to submit the same eight page report on the robustness of our production capabilities and we knew that all of our competitors do the same. Now, with a simulation, we can invite the customer to actually test us on that capability and we can demonstrate exactly how we have developed our processes to link to their requirements. The simulation really made us stand out and allowed us to demonstrate our innovation and commitment to continuous process improvement.”


Learn more about simulating supply chains

To learn more about how SIMUL8 could help guide your supply chain strategy, get in touch with our team.


Viewing all 24 articles
Browse latest View live